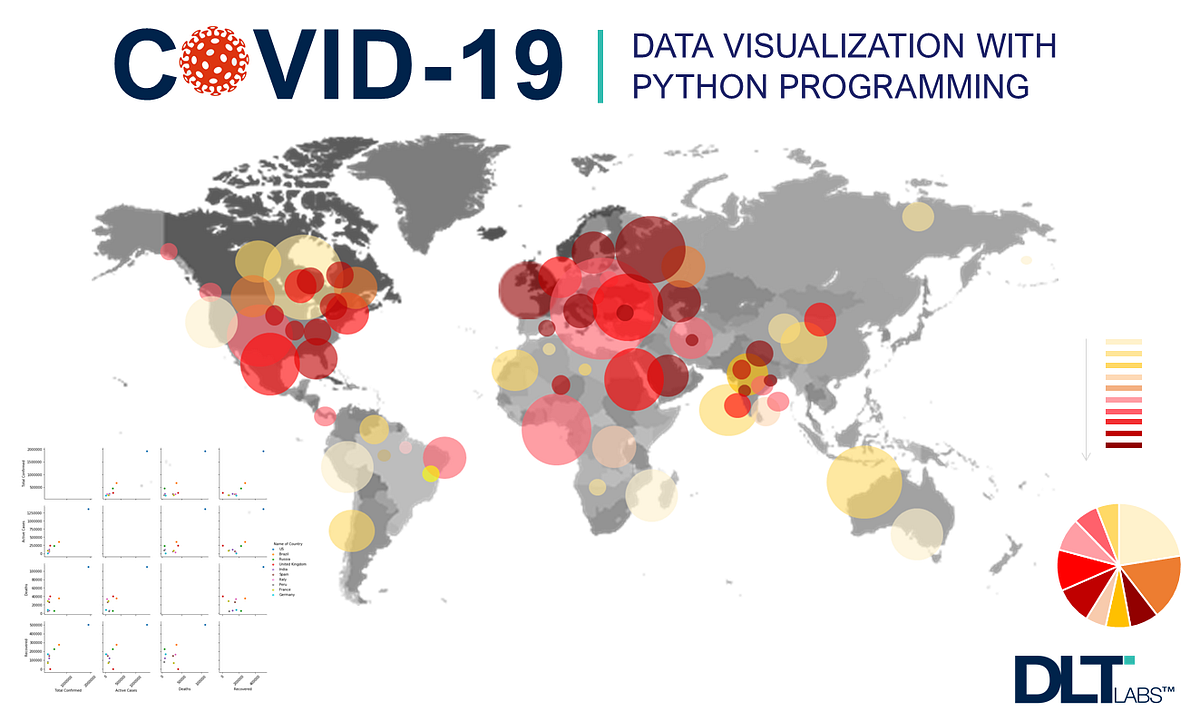
Visualizing data is important as it lets you understand trends better, allowing you to draw conclusions easier, and make better decisions.
As a developer at DLT Labs, I spend my day coding. I love exploring and learning programming in my free time. Visualizing data is programming, and a good way to get better at it is to play around with freely available data.
The current pandemic offers a practical source of numbers to practice.
So, without wasting time, let’s get started.
Prerequisites
You don’t need to be an expert in order to understand this post. Some understanding of basic Python and Linux is a plus to help you understand the coding; but as for the plots themselves, most of those described in this post are the ones we commonly use like bar chart and scatter plot.
#dltlabs #programming #python #technology #data-science
