In my previous role as a marketing data analyst for a blogging company, one of my most important tasks was to track how blog posts performed.
On the surface, it’s a fairly straightforward goal. With Google Analytics, you can quickly get just about any metric you need for your blog posts, for any date range.
But when it comes to comparing blog post performance, things get a bit trickier.
For example, let’s say we want to compare the performance of the blog posts we published on the Dataquest blog in June (using the month of June as our date range).
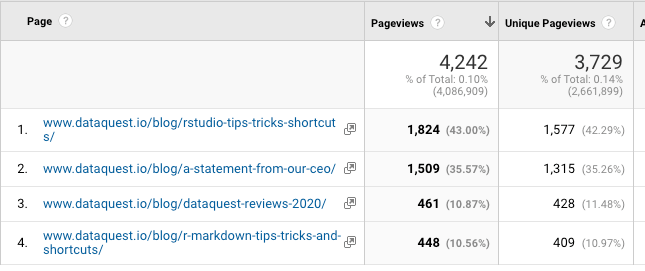
But wait… two blog posts with more than 1,000 pageviews were published earlier in the month, And the two with fewer than 500 pageviews were published at the end of the month. That’s hardly a fair comparison!
My first solution to this problem was to look up each post individually, so that I could make an even comparison of how each post performed in their first day, first week, first month, etc.
However, that required a lot of manual copy-and-paste work, which was extremely tedious if I wanted to compare more than a few posts, date ranges, or metrics at a time.
But then, I learned R, and realized that there was a much better way.
In this post, we’ll walk through how it’s done, so you can do my better blog post analysis for yourself!
What we’ll need
To complete this tutorial, you’ll need basic knowledge of R syntax and the tidyverse, and access to a Google Analytics account.
Not yet familiar with the basics of R? We can help with that! Our interactive online courses teach you R from scratch, with no prior programming experience required. Sign up and start today!
You’ll also need the dyplr, lubridate, and stringr packages installed — which, as a reminder, you can do with the install.packages() command.
Finally, you will need a CSV of the blog posts you want to analyze. Here’s what’s in my dataset:
post_url: the page path of the blog post
post_date: the date the post was published (formatted m/d/yy)
category: the blog category the post was published in (optional)
title: the title of the blog post (optional)
Depending on your content management system, there may be a way for you to automate gathering this data — but that’s out of the scope of this tutorial!
For this tutorial, we’ll use a manually-gathered dataset of the past ten Dataquest blog posts.
#data science tutorials #promote #r #r tutorial #r tutorials #rstats #tutorial #tutorials