Venn diagram is the most common diagram in scientific research articles and can be used to represent the relationship between multiple data sets. From Venn diagram, you can easily detect the commonalities and differences among those datasets. This tutorial will show you three different ways to create Venn diagrams in Python and how to beautify these diagrams.
Part 1: How to Create Venn Diagram
- Step1: you need to install the library named matplotlib-venn.
pip install matplotlib-venn
- Step2: import libraries
#Import libraries
from matplotlib_venn import venn2, venn2_circles, venn2_unweighted
from matplotlib_venn import venn3, venn3_circles
from matplotlib import pyplot as plt
%matplotlib inline
- Step3: create datasets for data visualization
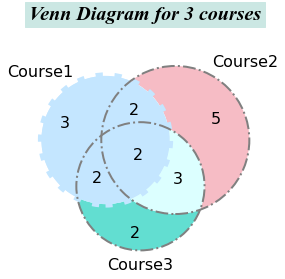
The letters in each dataset represent the student names and we would like to visualize how many students are enrolled in each course, how many of them are enrolled in two and three courses.
Course1=[‘A’,’B’,’C’,’E’,’F’,’G’,’I’,’P’,’Q’]
Course2=[‘B’,’E’,’F’,’H’,’K’,’Q’,’R’,’S’,’T’,’U’,’V’,’Z’]
Course3=[‘C’,’E’,’G’,’H’,’J’,’K’,’O’,’Q’,’Z’]
- Step4: visualize Venn diagram
Let us start to draw a Venn Diagram with 2 groups.
There are 3 main methods to make a Venn diagram with the matplotlib library, leading to the same result.
Method 1 is the most straightforward one. Put two datasets directly.
#Method1: put two datasets directly
venn2([set(dataset1), set(dataset2)])
plt.show()
You will get a Venn diagram like this:

Venn Diagram 1
For method 2, you need to know below numbers first.
- Ab = Contained in the left group (indicated as A here), but**_ not the right group_** (indicated as B here)
- aB = Contained in right group B, but not the left group A
- AB = A⋂B; contained in both groups.
The subsets parameter is a 3 element list where the numbers 5, 8, 4 correspond to Ab, aB, AB.
#Method 2:
venn2(subsets = (5, 8, 4))
plt.show()
You will get the same diagram as Venn Diagram 1. Matplotlib automatically assigned A and B to the Venn diagram.
For method 3, you need to pass a dictionary to the parameter subset.
#Method 3:
venn2(subsets = {‘10’: 5, ‘01’: 8, ‘11’: 4})
plt.show()
The key is the binary encoding method. So the three keys must be “10”, “01” and “11”, and each value after the key represents the size of the corresponding area.
#python #data science
