This is a central aspect of Data Science, which sometimes gets overlooked. The first step of anything you do should be to know your data: understand it, get familiar with it. This concept gets even more important as you increase your data volume: imagine trying to parse through thousands or millions of registers and make sense out of them.
By Diego Lopez Yse, Data Scientist

Machine Learning discussions are usually centered around algorithms and their performance: how to improve the model accuracy or reduce its error rate, excel at feature engineering or finetune hyperparameters. But there is a concept that comes before anything else: Exploratory Data Analysis, or EDA.
**EDA is about making sense out of data before getting ourselves busy with any model. **Which makes total sense, right? Which model are we going to use if we don’t know our data yet?
Before there was a Machine Learning model, there was EDA
This is a central aspect of Data Science, which sometimes gets overlooked. The first step of anything you do should be to know your data: understand it, get familiar with it. What are the answers you’re trying to get with that data? What variables are you using, and what do they mean? How does it look from a statistical perspective? Is data formatted correctly? Do you have missing values? And duplicated? What about outliers?
This concept gets even more important as you increase your data volume: imagine trying to parse through thousands or millions of registers and make sense out of them. Next, I want to share my Python method to answer some of these questions in the most efficient way.
Describe the dataset
For this article I use an economic dataset from the World Bank, describing some worldwide key factors such as GDP, population levels, surface, etc. You can find the dataset and full code here
First, we need to import some libraries:
import pandas as pd
import numpy as np
import seaborn as sns
import xlrd
Pandas, Numpy and Seaborn are key in any EDA exercise. The “xlrd” package is only required for our example since we’re using an Excel file as the data source.
Now, let’s import the dataset:
df = pd.read_excel(“wbdata.xlsx”)
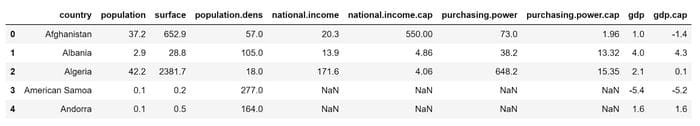
Take a look at the data:
df.head()
df.describe()
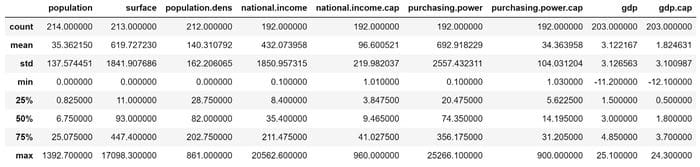
Some basic statistics of the numerical variables in the dataset.
df.shape

A quick way to see the structure of the dataset: 215 rows and 10 columns.
df.dtypes
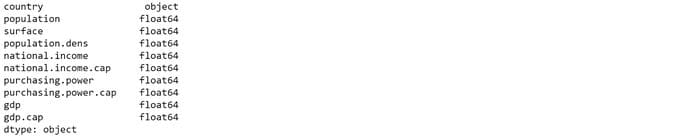
Check out the variables types: they are all floats, except for the country name which is a string. Find a tutorial on how to change variable types here.
df.info()
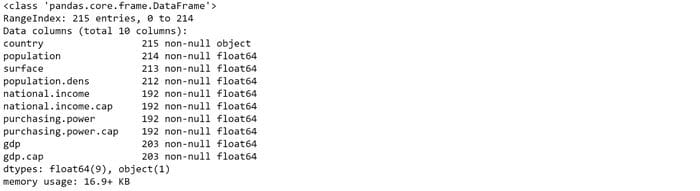
Here we see that there are some variables with null-values (e.g. the variable “population” has 1 row with missing value, “surface” 2, etc) . We’ll see how to deal with them below.
Missing values
Missing values can be caused by different reasons, such data entry errors or incomplete records. This is extremely common and can have a significant effect on the conclusions that can be drawn from the data.
We’ve seen above that the dataset in this example has several missing values, but let’s see how you can test any dataset. The first question you may want to ask you is: are there any missing values?
print(df.isnull().values.any())
#2020 jul tutorials # overviews #data analysis #data exploration #data preparation #pandas #python