Let’s face it, fellow data scientists: our clients LOVE dashboards. Why wouldn’t they? Visualizing our data helps us tell a story. Visualization turns thousands of rows of data into a compelling and beautiful narrative. In fact, dashboard visualizations have become so commonplace that virtually every resume features at least one (maybe several) dashboard projects. How can you make yours stand out? Bar charts and time-series line graphs aren’t going to cut it.
Maps help us tell a story!
Enter: geographic data.What is geographic data? Broadly speaking, it’s anything you can put on a map. Does it have lat/lon coordinates? Does it exist in geographic space? That’s geographic data.
Maps help us tell stories. Think to some of your favorite novels — how many of them have maps in their pages? Maps immerse us in the environment of the story; in this case, the story of your client’s data.
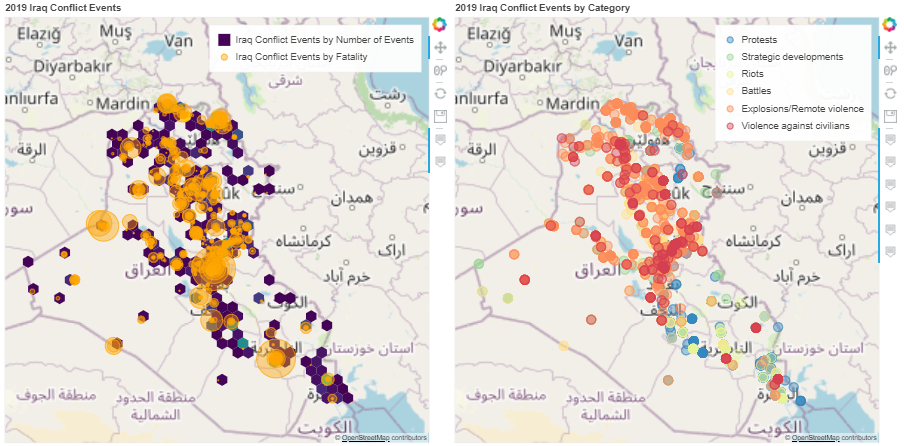
This article will teach you to deal with three types of maps: heatmaps, bubble maps, and categorical maps. By the end of this tutorial, you’ll be a spatial data wizard ready to set your dashboard visualizations apart from the rest.
Let’s dive in!
#maps #dashboard #python #data-science