I believe that the pursuit of science is to explore the beautiful nature around us and discover her secrets. I find pleasure, in doing so. Thus, I have used data to answer my question:
How many seasons are there?
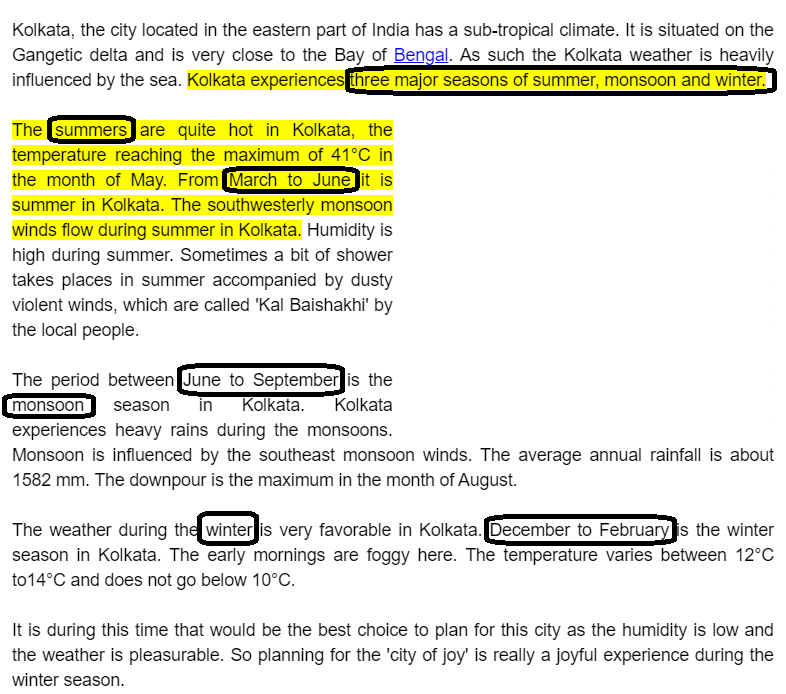
I have used the data for 2019 of my city Kolkata. I have collected the data on average temperature and **precipitation **on a monthly basis — indeed a very small data set, and it wonderfully speaks.
Domain Knowledge
Source: https://www.mapsofindia.com/
There are three major seasons in Kolka:
Summer
Monsoon
Winter
The Data Analysis
Let’s load the libraries.
library(tidyverse)
library(cluster)
library(factoextra)
library(gridExtra)
library(ggplot2)
The Data.
names = c("Jan","Feb","Mar","Apr","May","June","July","Aug","Sep","Oct","Nov","Dec")
temp = c(79.7,84,92.7,96.6,95.7,92.1,88.9,89.1,89.8,88.7,84,79.2)
prec = c(14,22,28,51,126,301,375,339,305,141,26,7)
data = data.frame(temp,prec)
row.names(data) = names
data
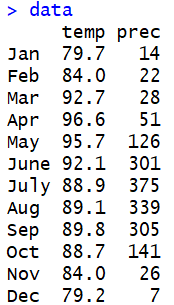
The Data Frame
Visualize the Data.
ggplot(data, aes(x=temp, y = prec)) + geom_point() +
  geom_text(aes(label= names),hjust=0, vjust=0)+labs( title= "Climate of Kolkata", y="Precipitation", x = "Temperature")

Can you see the clusters of months?
#machine-learning #artificial-intelligence #deep-learning #nature #statistics #data analysis

1.25 GEEK