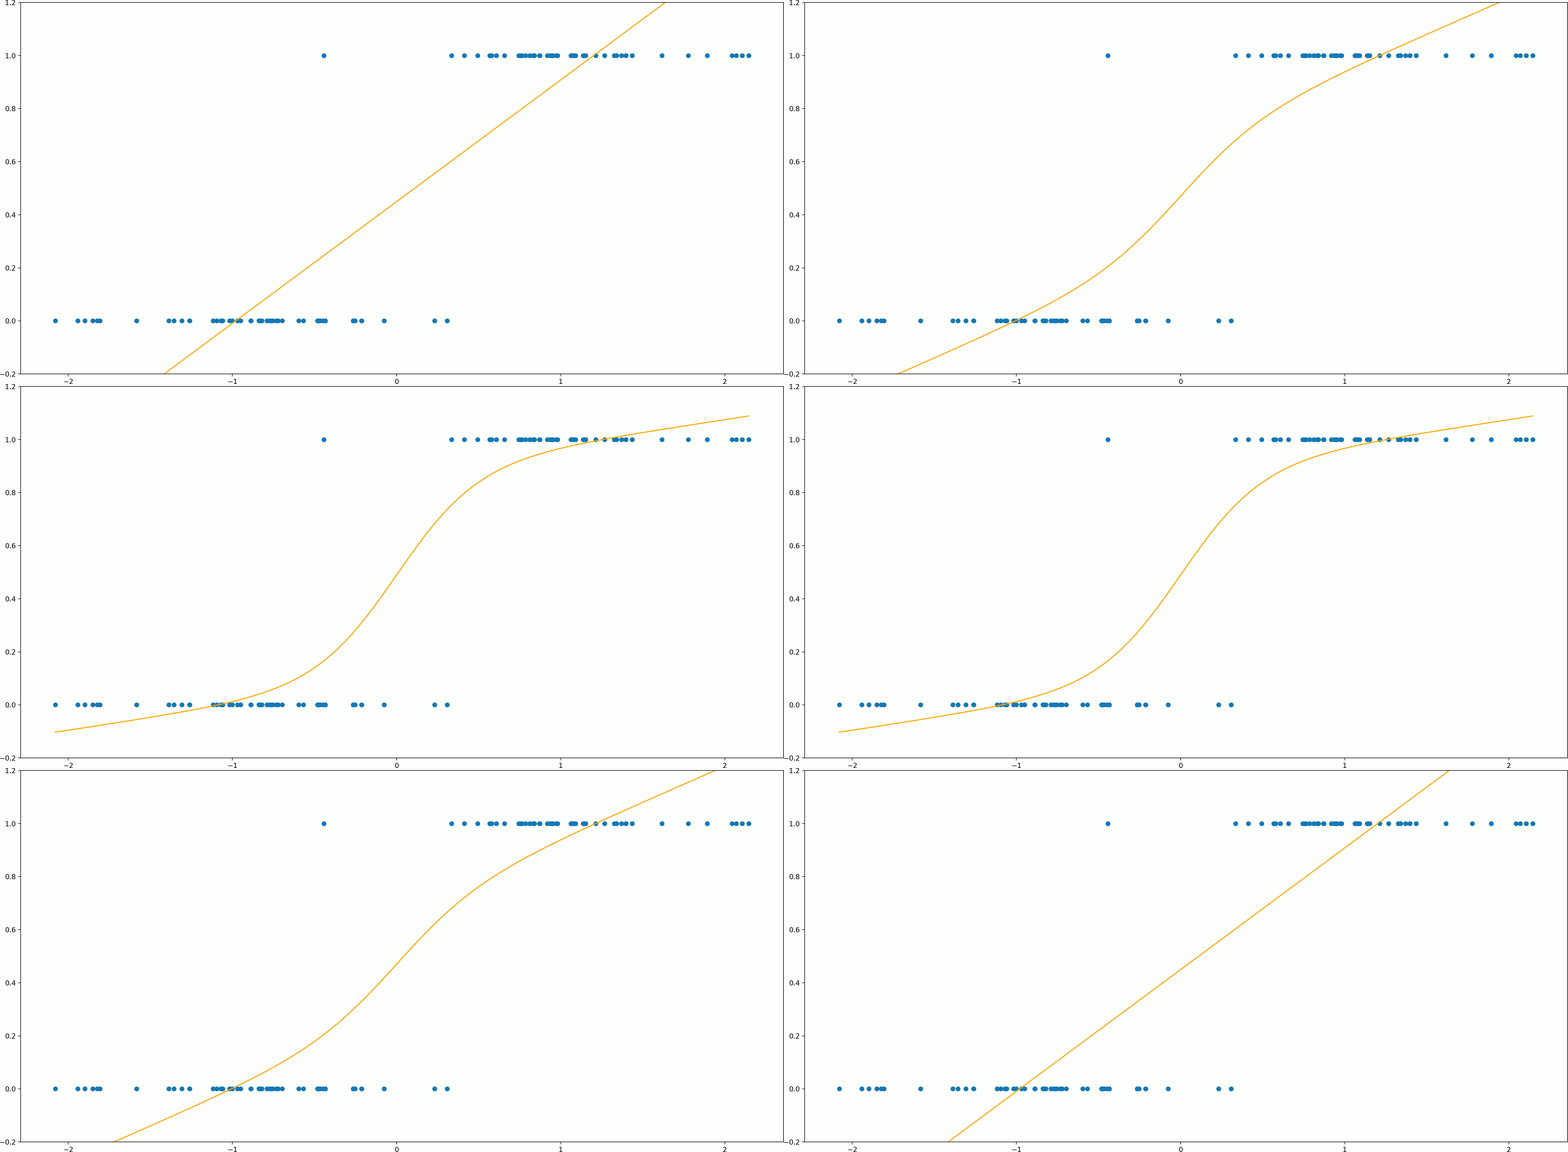
What is logistic regression? Logistic regression is just adapting linear regression to a special case where you can have only 2 outputs: 0 or 1. And this thing is most commonly applied to classification problems where 0 and 1 represent two different classes and we want to distinguish between them.
Linear regression outputs a real number that ranges from -∞ to +∞. And we can use just this even in the 0/1 classification problem: if we get a value >= 0.5 report it as class label 1, if the output is < 0.5 report it as a 0.

Where x is a vector of features (plus a component with constant 1 for bias) of one observation, and w is the weights vector.
But, we can get slightly better results both in terms of accuracy and interpretability if we squash the regression line into an “S”-shaped curve between 0 and 1. We squash the regression line by applying the sigmoid function to the output value of a linear regression model.
Below is the sigmoid function:

More exactly, we compute the output as follows: take the weighted sum of the inputs, and then pass this resulting number into the sigmoid function and report the sigmoid’s output as the output of our logistic regression model.
This procedure helps us both in getting slightly better accuracy and in the interpretability of the output. If our model outputs any real number like -5 or 7, what these numbers actually mean? What can we tell about our two classes: 0 and 1?
But, when we have outputs between 0 and 1, we can interpret them as probabilities. The output of a logistic regression model is the probability of our input belonging to the class labeled with 1. And the complement of our model’s output is the probability of our input belonging to the class labeled with 0.
#machine-learning #data-science #artificial-intelligence #mathematics #logistic-regression
