I recently came across this survey by the Gallup International Association Corona Tracker
We all love a conspiracy theory! 36% globally blame foreign power for COVID-19. The margin of error for the survey is 3 at 95 per cent confidence level. More than 20,000 interviews were conducted globally for this survey.
I tried to find more about the Confidence Interval and Margin of Error but they seem to be quite hard to understand for someone without in-depth knowledge of statistics. The challenge is most of the explanations rely on a lot of jargon which a layman might not know about.
In this article, I would try to explain the concepts margin of error and confidence intervals without too much mathematics and fancy statistics terms.
Photo by Element5 Digital on Unsplash
Let say a news agency is trying to figure out what percentage of the population would vote for a political party A in the upcoming election. As it is almost impossible to interview the entire population, they randomly select a sample of say 100 people. Out of those 100 people interviewed, 43 are willing to vote for A.
Let’s convert the problem in mathematical terms. We are going to say, sampling someone who is going to vote for A is equivalent to sampling 1, and sampling someone who is not going to vote for A is equivalent to sampling 0. It means that out of those 100 samples 43 are 1 and the remaining 57 are 0.
Now let’s define some mathematical symbols:
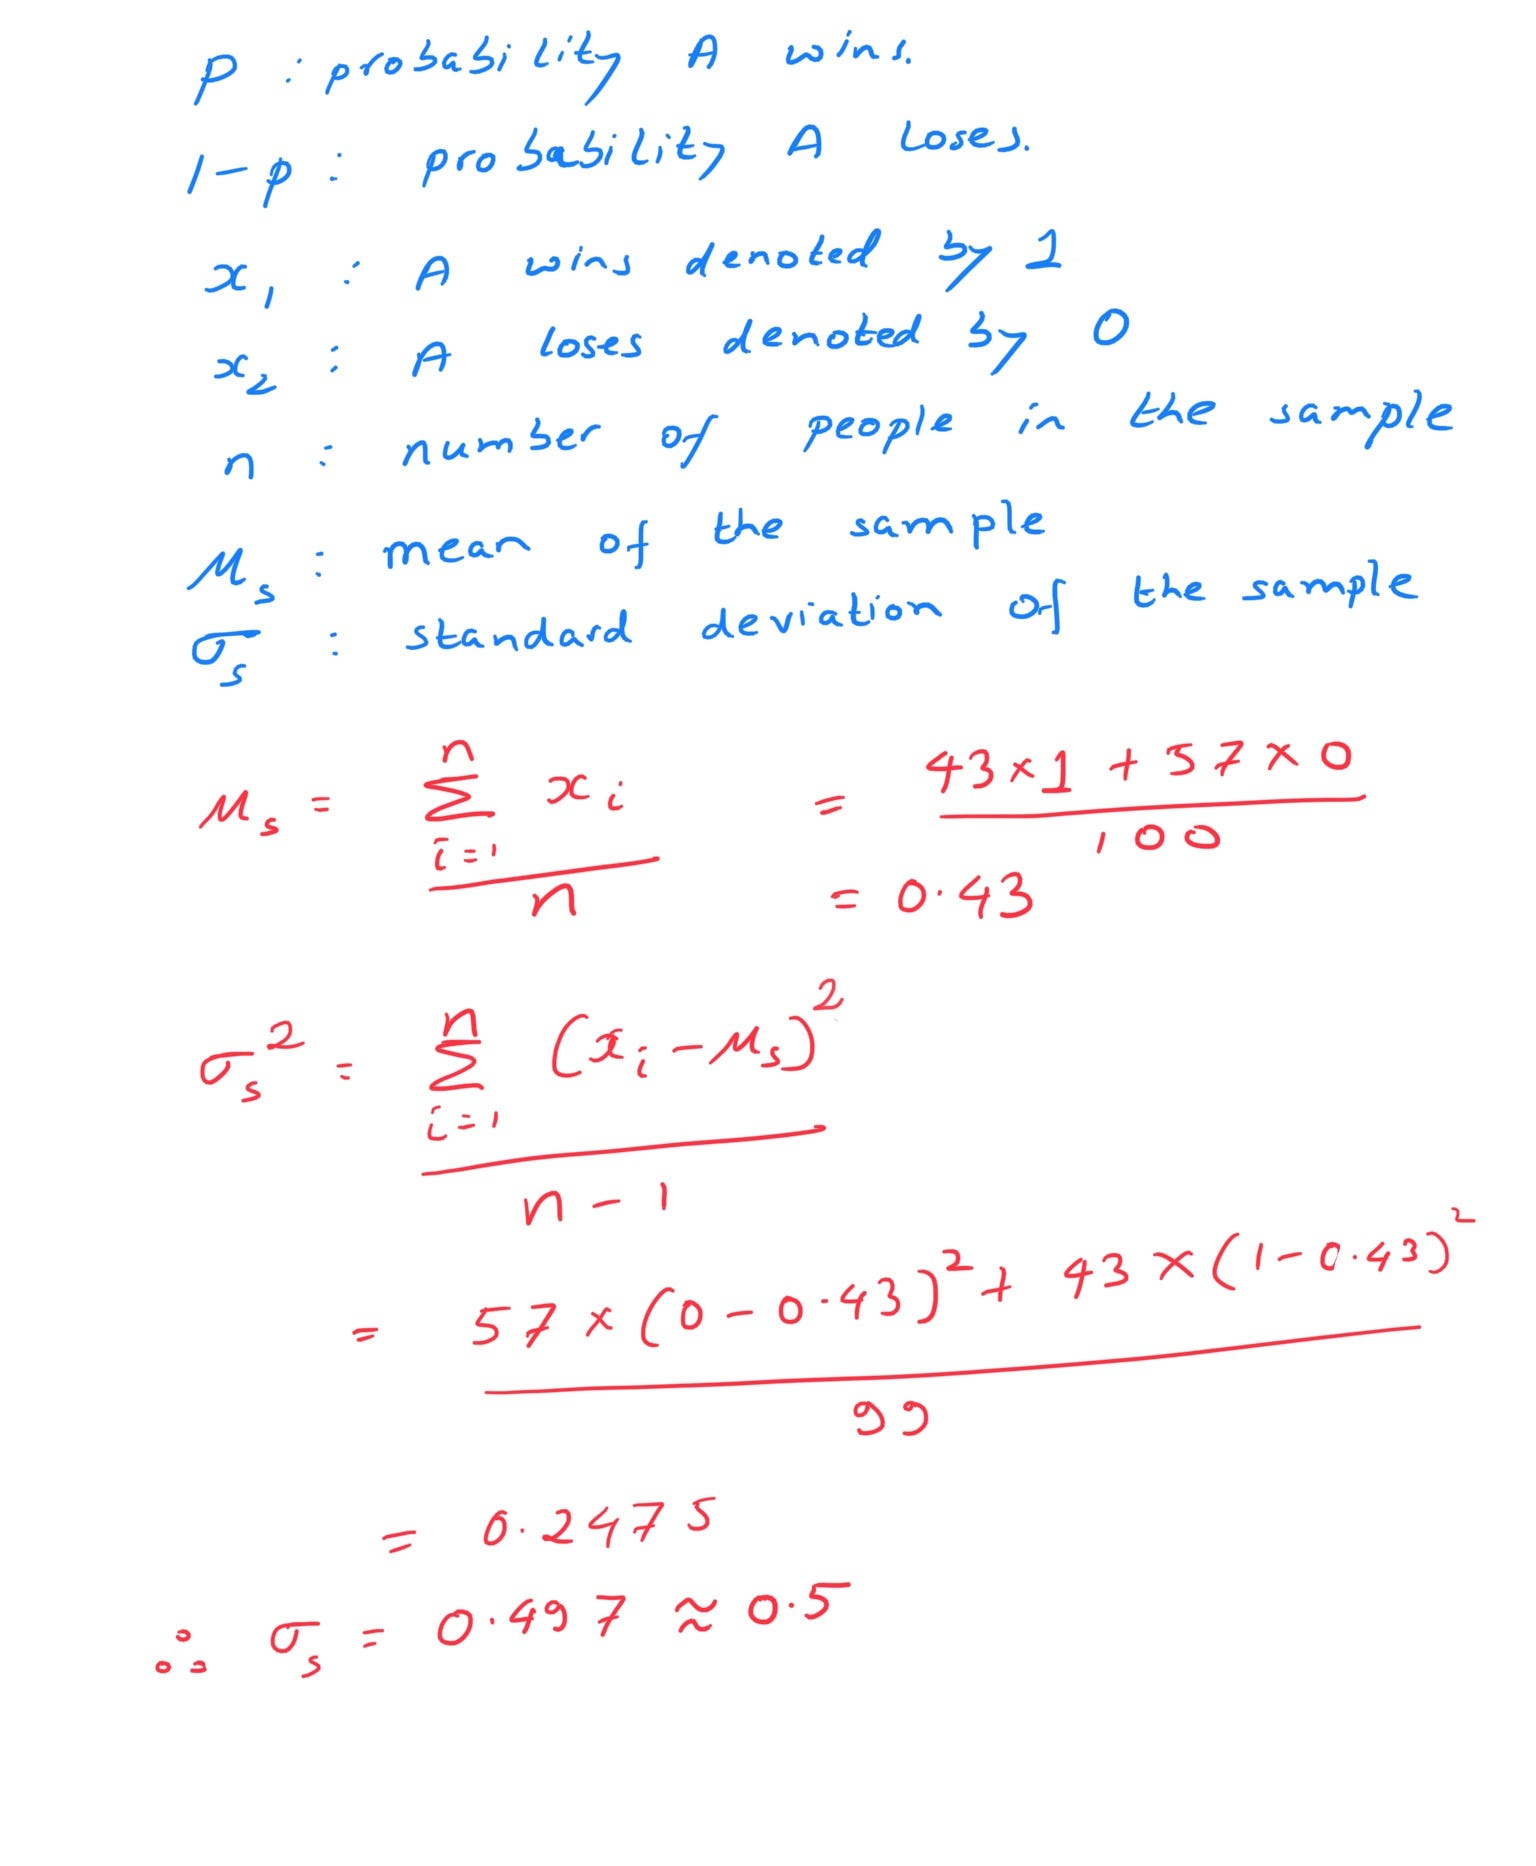
Here you might wonder why the denominator for calculating the standard deviation is** n-1** instead of n_. _This is done using Bessel Correctionto remove the bias in the estimation of the population variance. Refer here for more information.
#towards-data-science #mathematics #interview #statistics #data-science #data analysis