Build an Analytics Dashboard with Python, Streamlit, and MySQL
In this video, you will learn how to create an analytics website dashboard using Python and the Streamlit library. We will use a MySQL database to store the data, and we will use Streamlit to create an interactive dashboard that allows us to visualize and explore the data.
Video contents:
1. how to download and install python
2. how to install streamlit
3. how to start a new project
4. how to upload Excel file to Mysql
5. how to connect stremlit and Mysql
6. how to print data to Dataframe()
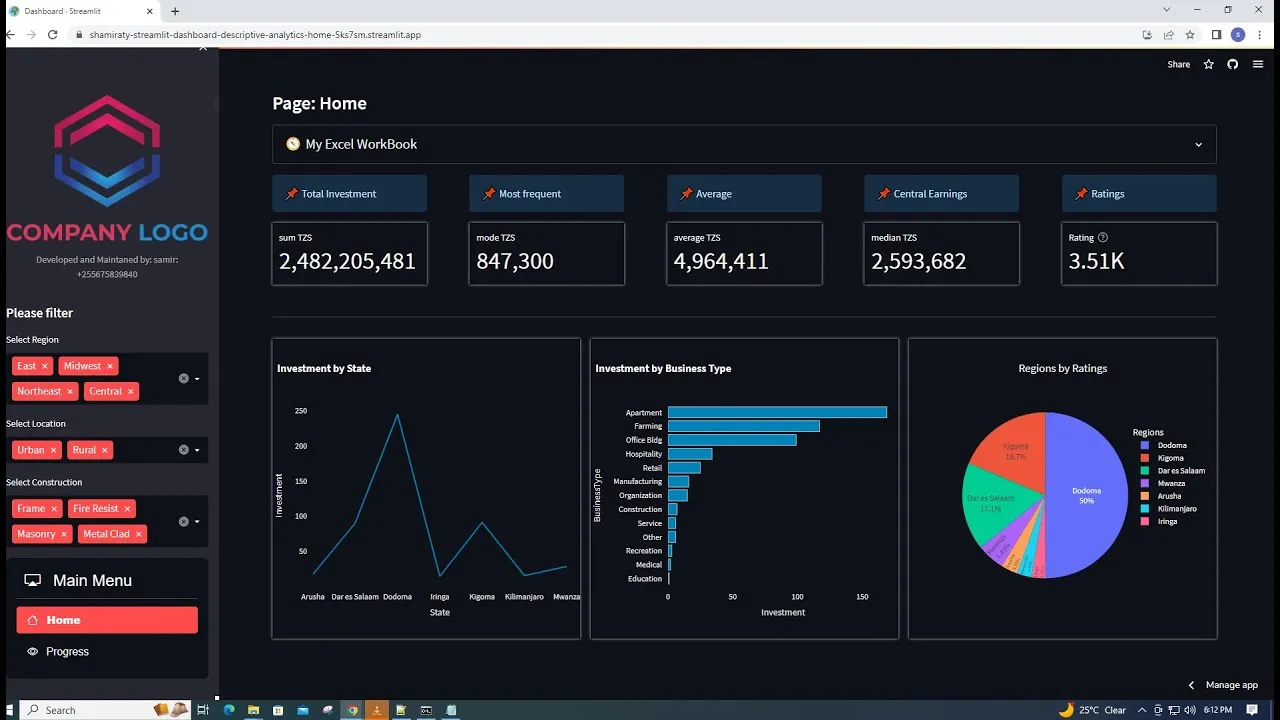
7. how to compute central tendencies
8. how to plot graphs in streamlit
9. how to create sidebar in streamlit
10. how to create multi-selector to sidebar:
Download Python: https://www.python.org/downloads/
Emoji: https://www.webfx.com/tools/emoji-cheat-sheet/
Bootstrap icon: https://icons.getbootstrap.com/
Live demo: https://shamiraty-streamlit-dashboard-descriptive-analytics-home-5ks7sm.streamlit.app/
Source code: https://github.com/shamiraty/Streamlit-Dashboard-Descriptive-Analytics-with-MYSQL
Subscribe: https://www.youtube.com/@swahiliicttutorials5568/featured