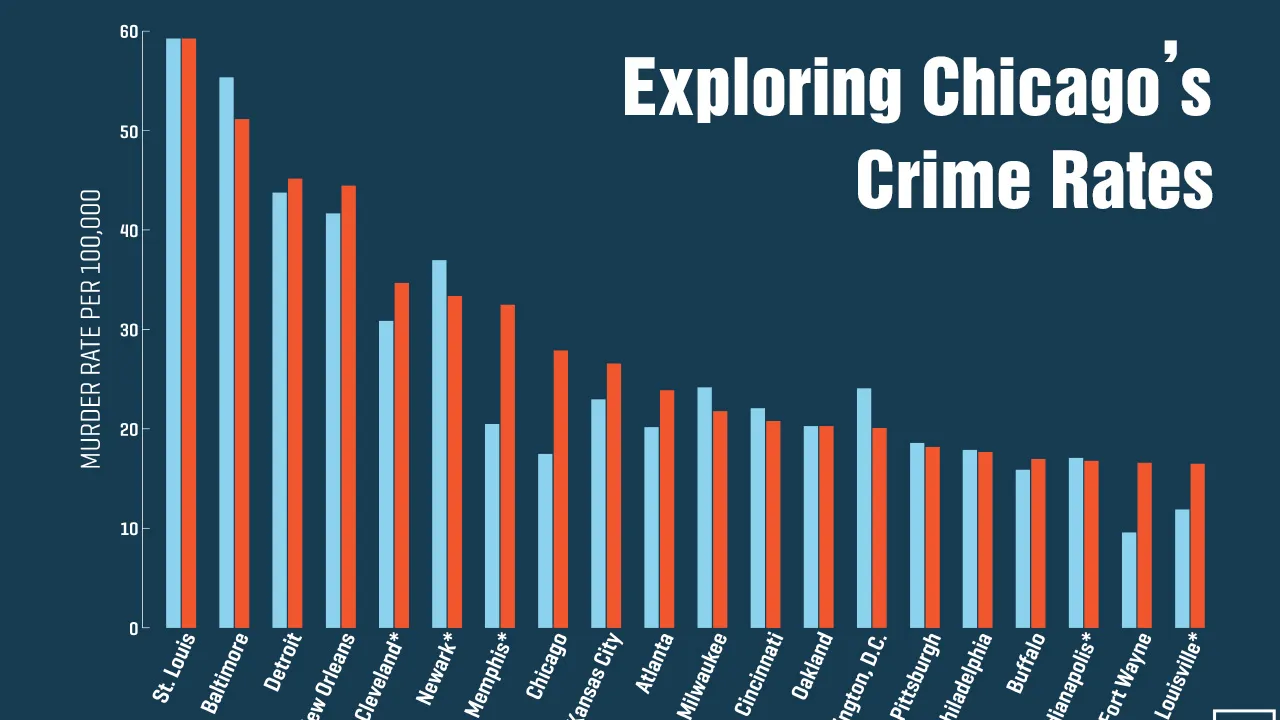
Taking a deep dive into Chicago’s crimes from 2012–2017
PHASE 1: Exploring the shape & structure of the data
Step 1: Gaining a higher-level understanding of the data
To begin, I looked at the shape of my data. I see there are 1456714 rows and 23 columns. These columns left to right are Unnamed, ID, Case Number, Date, Block, IUCR, Primary Type, Description, Location Description, Arrest, Domestic. Beat, District, Ward, Community Area, FBI Code, X Coordinate, Y Coordinate, Year, Updated On, Latitude, Longitude, and Location.
Step 2: Finding data quality issues
**ISSUE ONE: **The first column was unnamed and contained random digits for each row. As there was already an index, I deleted this column.
ISSUE TWO: Near the right end of the data frame, there was Latitude, Longitude, and Location. This Location column was just a repeat of the Latitude and Longitude values. I removed this and kept the separate Latitude and Longitude columns to ease processing.
**ISSUE THREE: **Several column names were composed of two words with spaces in between. To ease processing, I renamed these columns to have an underscore instead of the space.
#chicago #pandas-dataframe #data #sql #crime #exploring chicago’s crime rates