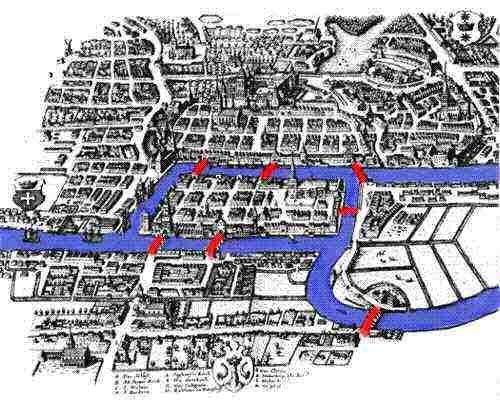
What does the history of mathematical epidemiology have to do with a modern pandemic? Everything really. Not much has changed except how we graphically represent it — namely with Graph — and its capacity to handle larger, world-reaching datasets. Hopefully, this piece will give you a primer to help you begin to understand the struggle we’re in today as we try to solve a mathematical problem like COVID-19.A brief history of mathematical epidemiologyMathematical modelling of epidemics dates back as far as the 18th-century Swiss mathematician Daniel Bernoulli, who, apparently not content with fundamental work in mechanics, statistics and economics, also created the first known mathematical model of the spread of an epidemic. His model gave a life expectancy in terms of the infection rate and the mortality rate, applied to the outbreaks of smallpox that were then prevalent throughout Europe.It was another disease which inspired what many consider the foundation of the science of epidemiology, namely cholera. Cholera outbreaks were a quite frequent phenomena in the 1800s in London, due to inadequate infrastructure, overcrowding, and a lack of an accurate medical model of germs and infection. It seems remarkable now, but there were two competing theories at the time: germ theory, and miasma theory. Miasma theory held that cholera, and other diseases, was due to decaying organic matter transmitted in the air — perhaps not as odd a theory as it might seem today, given the pollution then prevalent in central London, and the lack of a sewage system throughout many parts of the capital.John Snow was, in many ways, the first data scientist. He created a map of infections of an outbreak in Soho, around Broad Street, in 1854. He rejected the prevailing miasma theory, and concentrated instead on tracing the spread of cholera through the water system. He traced infections using what would now be called a Voronoi diagram. Eventually, he posited a particular water pump as the likely source of the cholera outbreak. His work provided empirical evidence for the germ theory, and established water supplies as the primary transmission agent for cholera. His work also led to major revisions in public health legislation concerning the provision of clean water and safe waste disposal. There is a pub in Soho, close to the water pump which was ground zero for the Broad Street infection, which bears his name.Many epidemiological models have been developed since this seminal work, including systems of differential equations, stochastic processes, and those based on graphs. We will look at how graph theory can be applied as a model of the spread of disease.What is a graph?Graph theory as an object of mathematical inquiry dates back to a problem known as the Seven Bridges of Königsberg. It is a problem which sounds quite simple to state, but its solution led Leonhard Euler to develop a wholly new mathematical theory in order to arrive at a definitive answer. While solving this problem, Euler invented graph theory; this is the sort of thing Euler did rather a lot of, making fundamental contributions to physics, astronomy, geography, logistics, topology, number theory, calculus, and an eye-watering number of other fields.Two rivers ran through the city of Königsberg, and seven bridges crossed them. The problem which preoccupied Euler, and led to the discovery of graph theory, was to create a walk which crossed the each of the bridges once, but only once. A map of Königsberg is given below, with the rivers given in blue and the bridges in red.
#data-science #epidemiology #health #graph-theory #mathematics #data analysis