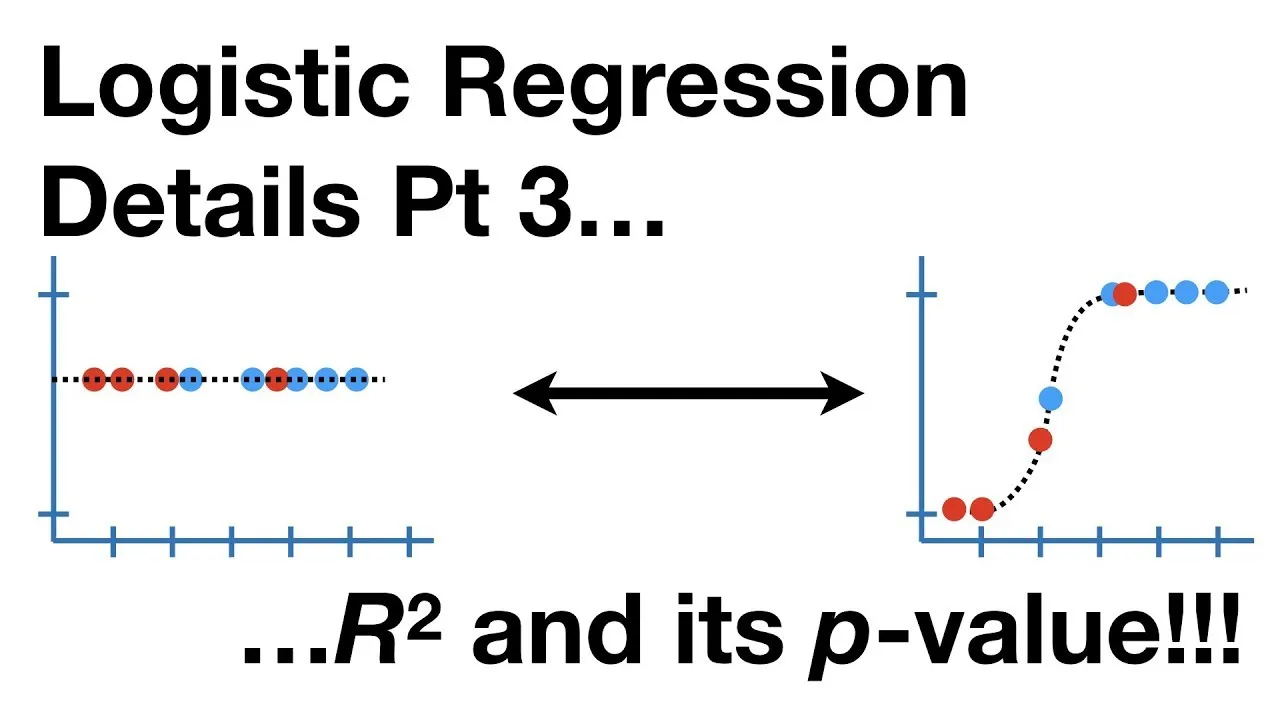
This video follows from where we left off in Part 2 in this series on the details of Logistic Regression. Last time we saw how to fit a squiggly line to the data. This time we’ll learn how to evaluate if that squiggly line is worth anything. In short, we’ll calculate the R-squared value and it’s associated p-value.
> NOTE: The formula at 13:58 should be 2[(LL(saturated) - LL(overall)) - (LL(saturated) - LL(fit))]. I got the terms flipped.
#machine-learning
2.70 GEEK
