Here are five options with a range of capabilities, customizations, and price points to begin building your organizational chart.
To make this info useful for different categories of readers, we’ve gathered together libraries with different functionality and pricing policy. To help you decide whether one of them is worthy of your attention or not, we’ll take a look at the main features and check if the documentation is user-friendly.
DHTMLX Diagram Library
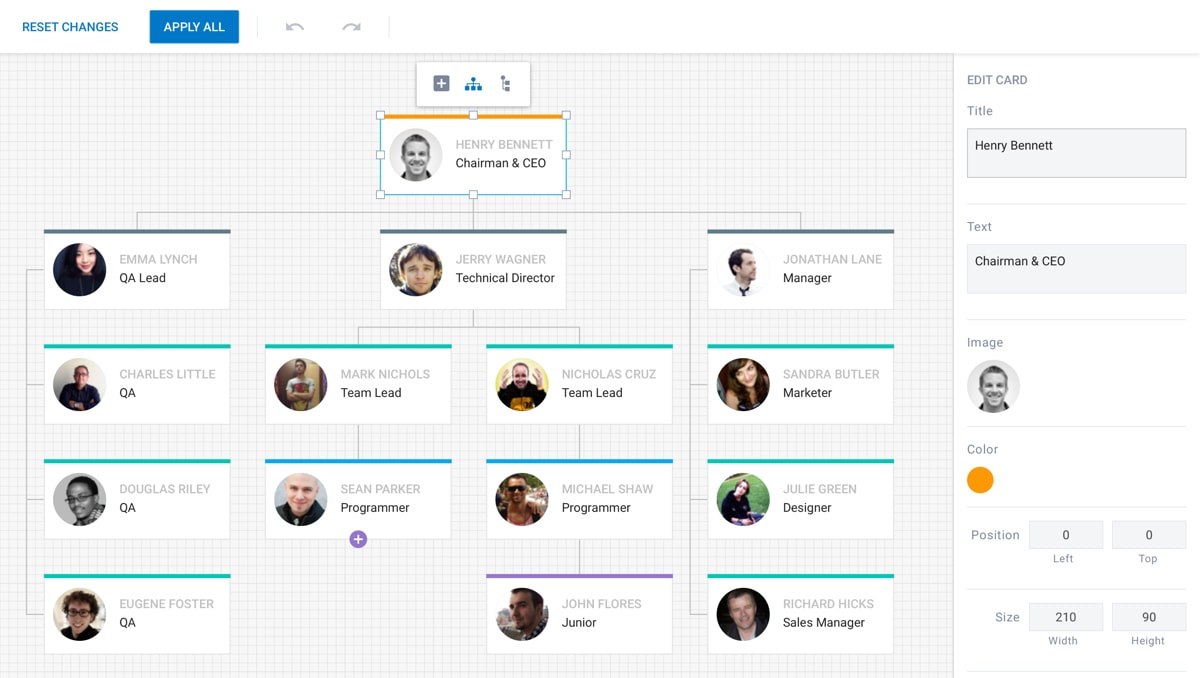
The DHTMLX diagram library allows creating easily configurable graphs for visualization of hierarchical data. Starting from version 2.0, besides org charts, you can create almost any type of hierarchical diagrams. You can choose from organizational charts, block and network diagrams, hierarchical diagrams, mind maps and other types of diagrams.
The library has an exporting feature. You can export your diagram to a PDF or PNG file. The edit mode gives an opportunity to make changes on-the-fly without messing with the source code. An interactive interface of the editor supports drag-and-drop and permits you to change each item of your diagram. You can drag diagram items with your mouse and set the size and position property of an item via the editor. Diagram nodes can contain text, custom HTML and SVG elements as well as images. You can use custom CSS styles to create a unique style for your diagram. Zooming and scrolling features will be useful in case if you work with diagrams containing a big number of items. To show the structure of an organization compactly, you can use the vertical mode.
The documentation page will appeal both to beginners and experienced developers. A well-written beginner’s guide contains the source code with explanations. A bunch of guides will help with further configuration, so you’ll be able to create a diagram that better suits your needs. At the moment, there are two types of licenses available. theCommercial license for the team of five or fewer developers will cost you $149, while an enterprise license will cost $399 per company.
Rappid Diagramming Framework
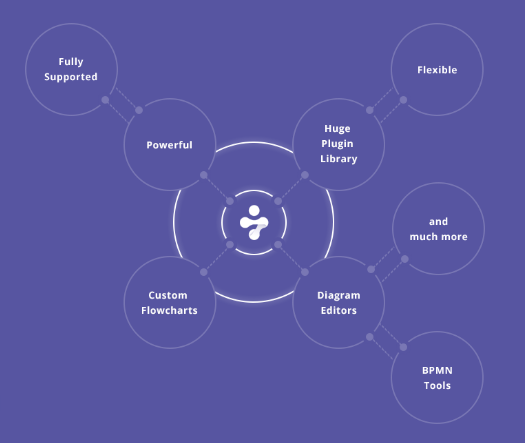
Rappid is a framework that allows developing online apps for creating different types of diagrams. With this tool, you can provide users with an access to interactive flowcharts, diagrams, and graphs. The UI of Rappid-based apps is fully customizable, so you can achieve the desired user experience and create appearance according to the style of your site. Rappid can be integrated with any online application and works well with any back-end technology.
This framework is designed to create Business Process Management tools, org charts, floor planners, and many other visualizations. If there is any data that can be visualized in 2D with the use of HTML5 and SVG, Rappid is the tool to get the job done. It’s compatible with major JavaScript frameworks such as jQuery, Angular, React, and Backbone.js. Also, this framework supports mobile devices, what enables you to create apps for tablets and smartphones.
Rappid provides developers with a wide variety of plugins to make complex visualization apps. Configurable control panels help you keep important tools close at hand. You can export your diagrams to JSON, PNG, JPEG, or SVG formats. There’s an option to change the layout of graph elements into a tree or grid, for example. You can add different types of charts to your diagram. These and many other plugins expand the functionality of Rappid-based applications.
You can check the demo page and a bunch of detailed tutorials, which provide info on the main features of Rappid and contains source code along with explanations. Rappid is a decent choice for those who are going to create an online visualization app that will meet the needs of the most demanding users. The standard support package will cost you 1500 Euros for a single developer, and the premium support package that includes extended support will cost 2500 Euros.
yFiles for HTML
yFiles for HTML enables you to add diagrams to your HTML5 web applications. This library provides different UI components for drawing and viewing editable graphs and diagrams. You can create client-side applications that don’t require any plugins or server components. However, if needed you can use server components based on Java or .NET for automatic layout or if you’re dealing with computationally-intensive tasks. It’s a pure JavaScript tool which works with major frameworks such as Angular and React. It supports the latest ECMAScript 6 features and permits the usage of TypeScript bindings.
The demo page demonstrates possibilities of this library. Almost every type of diagram, from mindmap to Sankey diagram, can be created with yFiles for HTML. The documentation page is pretty exhaustive and contains a step-by-step guide along with an API reference. yFiles for HTML has the most flexible pricing. You can choose a license for a single developer, for a team of 3 developers or for big teams consisting of more than four developers. The pricing starts from $11,900.00 and mounts up depending on the options you choose: license for a single app or for multiple apps, the number of domains that will be used, and other important aspects.
Google Charts
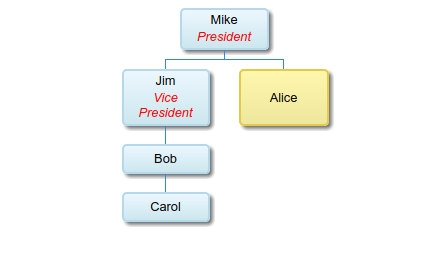
The organization chart is one of the chart types that you can create with Google Charts. Google charts is a set of simple yet powerful tools. There’s a rich gallery of charts to choose from. All charts are fully configurable what makes it easy to create a unique look and feel for your apps. Google Charts can work in all modern browsers and support all modern platforms with no need to install any plugins. It’s a free tool, so if you want to save your money and use the same chart tools as Google uses, this option will be a good choice for you.
GetOrgChart
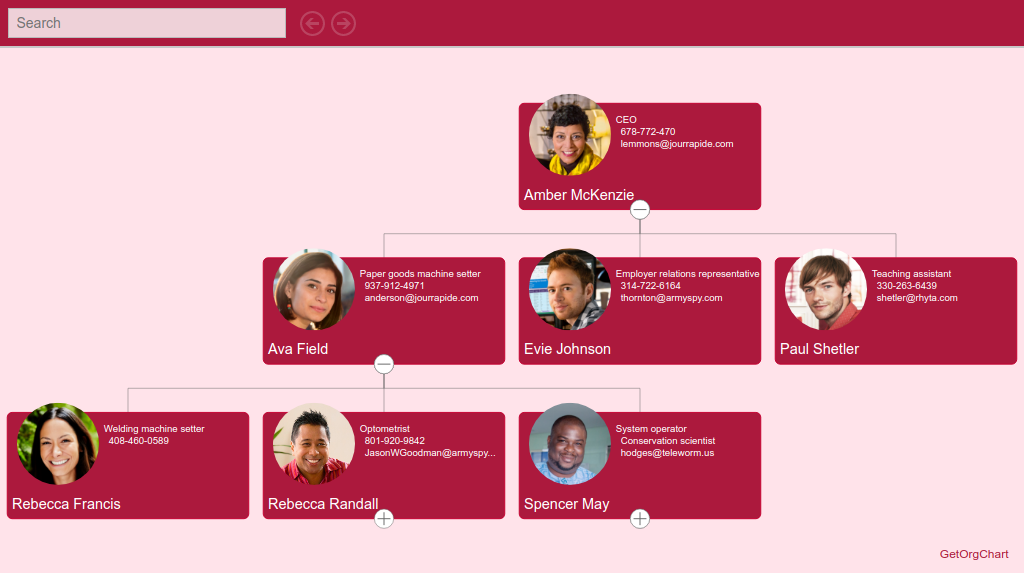
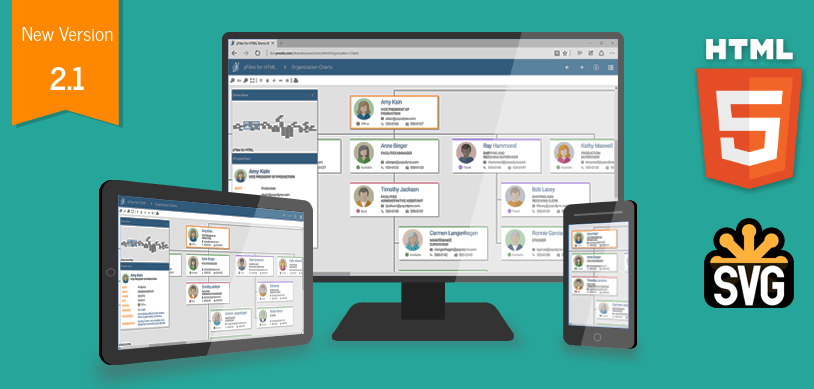
GetOrgChart is designed for making neat flowcharts using HTML5, CSS, and JavaScript. Using server-side components, developers can implement a specially crafted editing interface. To create unique appearance for your app, you can make use of a set of default skins and color palettes or make your own set. If your users work with big diagrams, a search field which allows finding a particular item will serve as a handful tool. Also, there’s a table mode in which raw data can be displayed without any visual elements.
The edit mode makes it easy to create and edit diagram items. All you have to do is type a name, title, some additional info, and GetOrgChart will build your diagram automatically. If you work with a big data set, you can collapse your diagram leaving only the part you’re working with. GetOrgChart has a zooming feature and enables navigation between items with navigation buttons. One of the best things about GetOrgChart is that it doesn’t require any special programming skills due to simple configuration syntax.
**GetOrgChart **is quite a minimalist tool judging by its demo page. If all you need from a library is a simple and easy-to-use org chart, it’ll be a decent choice. The documentation page is not very detailed and doesn’t contain any step-by-step guides. All you can get is an API reference. The good news is that **GetOrgChart **is the most affordable option among the libraries we’ve discussed (besides free Google Charts). You can use it for free for non-commercial projects, while the price of commercial license starts from 99$.
Conclusion
The choice of libraries for making org charts turns out to be really wide. Depending on your needs and, of course, your budget you can pick free and simple tools or more complicated and costly ones. You can try Google Charts absolutely for free and check if its functionality covers your needs. You might also like to choose GetOrgChart as a free tool for non-commercial projects. It can’t boast a detailed documentation page, yet it’s quite easy-to-use even if you don’t possess special programming skills. DHTMLX diagram library has moderate prices and provides a wide range of diagrams as well as some nice features for more elaborate charts with custom CSS. Rappid might be useful for creating apps for mobile devices at a reasonable price as well. yFiles allows creating almost any type of diagrams, however, the pricing is quite expensive. So it’s only left to choose the most suitable option for your purpose.
#javascript #web-development