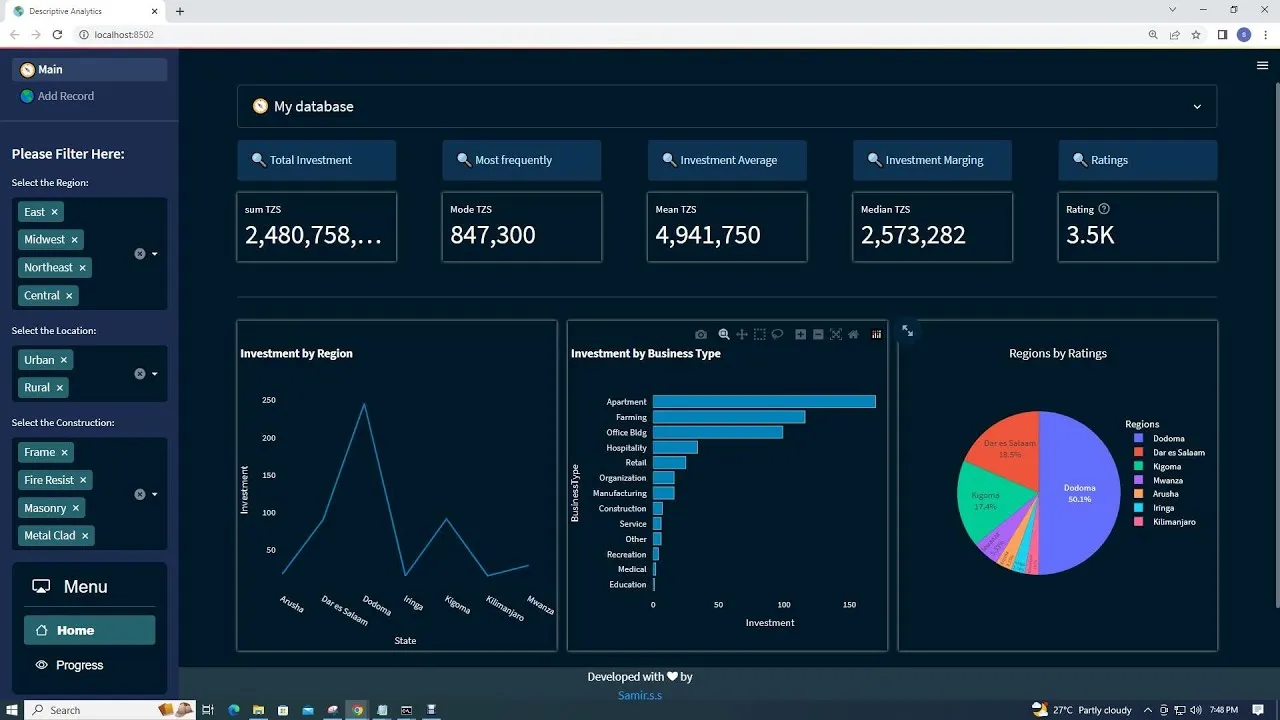
In this tutorial, we will learn how to build an interactive analytics dashboard website using Python, streamlit, CSS, HTML, and Excel as the data source. You'll learn how to create visually appealing graphs and charts to present your data insights effectively. Whether you're a beginner or an experienced developer, this guide will empower you to create insightful dashboards that drive data-driven decision-making.
VIDEO CONTENTS:
1. read and add record to excel file
2. visualize excel data by graphs
3. show simple analytics
4. Exceptional Handling
5. python form to add record to excel file
6. Progress Bar
7. Custom CSS
8. Custom Footer
9. Linking Pages
10. Icons
Live demo
https://shamiraty-analyticsdashboard-with-excel-file-main-kkkk2a.streamlit.app/
Source Code: https://github.com/shamiraty/AnalyticsDashboard-with-Excel-file/
Subscribe: https://www.youtube.com/@swahiliicttutorials5568/featured